This post outlines the steps I've taken to get a better insight into page requests and metrics for this site. First I wanted to add a 'hit counter' on each post page, then I wanted to be able to see where requests were coming from geographically and compare the amount of real traffic against bots and scans.
Hit Counter
I started with the flask-view-counter project, this library creates a log each time a view is requested in Flask. By then querying that data I'd essentially have a working hit counter fairly quickly.
Rather than importing the library I copied out the code that I needed because there were a few small changes I wanted to make. The String columns needed a length adding for MySQL 5.7 compatibility, then I opted to truncate the user-agent and args fields in case these values were excessive in certain requests. I also consolidated the datetime fields to just store one timestamp value.
Once done, import and initialise the library after app and db
from flask_view_counter import ViewCounter

#...

view_counter = ViewCounter(app, db)

#...
The library then provides a decorator that can be used with views to track their requests.
@app.route('/<slug>/')
@view_counter.count
def readpost(slug):

    #...
    return stuff
Each time that view is hit, there'll be a neat little entry in the database like this:
| id | timestamp_utc | ip | user_agent | path | status | args |
|---|---|---|---|---|---|---|
| 1 | 2022-03-22 18:32:04.911198 | 127.0.0.1 | Mozzilla/5.0 | /home/ | 200 |
I'm not so interested in capturing all of this data as ultimately I just want to count the rows per post but perhaps it'll be useful in future.
Displaying this data is also nice and easy using some raw SQL to return the count and provide it to the template.
@app.route('/<slug>/')
@view_counter.count
def readpost(slug):

    query = BlogPost.public().filter_by(slug=slug).first_or_404()

    view_count_sql = 'SELECT COUNT(id) from vc_requests where path="/' + slug + '/"'
    view_count = db.engine.execute(view_count_sql).scalar()

    return render_template(
        'readpost.html',
        blogpost=query,
        view_count=view_count
    )
The template then contains a line to display the hit count.
<h4 class="card-text my-3"><i class="fas fa-eye"></i> {{ view_count }}</h4>
Site Request Metrics / NGINX & Grafana
The changes so far are useful to store and display statistics per post, but what about the rest of the site? That data can be found in the NGINX logs...
Grafana recently announced a forever free plan supporting 50GB of logs and a 14-day retention which is more than enough for me to get started. All I need to do is start sending the logs.
The first step is to modify the NGINX log format and define a JSON structure. This has been done in a separate file, /etc/nginx/conf.d/grafana-cloud-nginx-integration.conf which will be loaded by default in nginx.conf.
That file contains the config below. The geoip2 configuration at the bottom will support mapping an IP address to a country when it comes to displaying the data. The final line states the location and format of the access logs going forward.
log_format json_analytics escape=json '{'
'"msec": "$msec", ' # request unixtime in seconds with a milliseconds resolution
'"connection": "$connection", ' # connection serial number
'"connection_requests": "$connection_requests", ' # number of requests made in connection
'"pid": "$pid", ' # process pid
'"request_id": "$request_id", ' # the unique request id
'"request_length": "$request_length", ' # request length (including headers and body)
'"remote_addr": "$remote_addr", ' # client IP
'"remote_user": "$remote_user", ' # client HTTP username
'"remote_port": "$remote_port", ' # client port
'"time_local": "$time_local", '
'"time_iso8601": "$time_iso8601", ' # local time in the ISO 8601 standard format
'"request": "$request", ' # full path no arguments if the request
'"request_uri": "$request_uri", ' # full path and arguments if the request
'"args": "$args", ' # args
'"status": "$status", ' # response status code
'"body_bytes_sent": "$body_bytes_sent", ' # the number of body bytes exclude headers sent to a client
'"bytes_sent": "$bytes_sent", ' # the number of bytes sent to a client
'"http_referer": "$http_referer", ' # HTTP referer
'"http_user_agent": "$http_user_agent", ' # user agent
'"http_x_forwarded_for": "$http_x_forwarded_for", ' # http_x_forwarded_for
'"http_host": "$http_host", ' # the request Host: header
'"server_name": "$server_name", ' # the name of the vhost serving the request
'"request_time": "$request_time", ' # request processing time in seconds with msec resolution
'"upstream": "$upstream_addr", ' # upstream backend server for proxied requests
'"upstream_connect_time": "$upstream_connect_time", ' # upstream handshake time incl. TLS
'"upstream_header_time": "$upstream_header_time", ' # time spent receiving upstream headers
'"upstream_response_time": "$upstream_response_time", ' # time spent receiving upstream body
'"upstream_response_length": "$upstream_response_length", ' # upstream response length
'"upstream_cache_status": "$upstream_cache_status", ' # cache HIT/MISS where applicable
'"ssl_protocol": "$ssl_protocol", ' # TLS protocol
'"ssl_cipher": "$ssl_cipher", ' # TLS cipher
'"scheme": "$scheme", ' # http or https
'"request_method": "$request_method", ' # request method
'"server_protocol": "$server_protocol", ' # request protocol, like HTTP/1.1 or HTTP/2.0
'"pipe": "$pipe", ' # "p" if request was pipelined, "." otherwise
'"gzip_ratio": "$gzip_ratio", '
'"geoip_country_code": "$geoip2_data_country_code", '
'"geoip_country_name": "$geoip2_data_country_name"'
'}';

geoip2 /etc/nginx/GeoLite2-Country.mmdb {
  $geoip2_data_country_code default=US source=$remote_addr country iso_code;
  $geoip2_data_country_name country names en;
}

access_log /var/log/nginx/json_access.log json_analytics;
The geoip2 data is stored in a GeoLite2-Country database available for download by having a free MaxMind account. Once downloaded, make sure the database is available as per the configuration above.
sudo mv /tmp/GeoLite2-Country.mmdb /etc/nginx/GeoLite2-Country.mmdb
In order for NGINX to create variables using the values obtained from the database - there needs to be additional modules installed.
In this case I had to download the NGINX source code for the version I had installed (1.14.0) and use it to build the modules available in the leev/ngx_http_geoip2_module repo.
First, install the MaxMind + additional libraries required for building.
sudo add-apt-repository ppa:maxmind/ppa
sudo apt update
sudo apt install -y libmaxminddb0 libmaxminddb-dev mmdb-bin libpcre3-dev zlib1g-dev libssl-dev libxslt-dev libgd-dev libgeoip-dev
Then download the modules, NGINX source code and build the module.
The configure command below uses $(nginx -V) to highlight that the modules must be built using the same build arguments as the installed NGINX package. In my experience the arguments need to be passed explicitly as the shorthand above doesn't expand properly, but the command below would be significantly longer.
cd && mkdir nginx-temp && cd nginx-temp

git clone https://github.com/leev/ngx_http_geoip2_module.git

wget http://nginx.org/download/nginx-1.14.0.tar.gz
tar -xzvf nginx-1.14.0.tar.gz

cd nginx-1.14.0

./configure --add-dynamic-module=$HOME/nginx-temp/ngx_http_geoip2_module $(nginx -V)
make
sudo make install
Modify /etc/nginx/nginx.conf and add the following lines to import the modules that have just been built.
load_module modules/ngx_http_geoip2_module.so;
load_module modules/ngx_stream_geoip2_module.so;
Test the nginx config and reload if everything looks good.
sudo nginx -t
sudo service nginx reload
After signing up to Grafana there's a list of available integrations, one of which is NGINX which will provide a command using your account ID and KEY (omitted below) to install the grafana-agent service on a machine via their install script.
sudo ARCH=amd64 GCLOUD_STACK_ID=${MY_ID} GCLOUD_API_KEY=${MY_KEY} GCLOUD_API_URL="https://integrations-api-eu-west.grafana.net" /bin/sh -c "$(curl -fsSL https://raw.githubusercontent.com/grafana/agent/release/production/grafanacloud-install.sh)"

sudo systemctl status grafana-agent.service
This process will have also created a config file /etc/grafana-agent.yaml that needs to be modified to add a hostname for identication and the path to the NGINX JSON log file.
integrations:
  prometheus_remote_write:
  - basic_auth:
      password: <pass>
      username: <id>
    url: https://prometheus-prod-01-eu-west-0.grafana.net/api/prom/push
logs:
  configs:
  - clients:
    - basic_auth:
        password: <pass>
        username: <id>
      url: https://logs-prod-eu-west-0.grafana.net/api/prom/push
    name: integrations
    positions:
      filename: /tmp/positions.yaml
    scrape_configs:
    - job_name: integrations/nginx
      static_configs:
      - labels:
          __path__: /var/log/nginx/json_access.log
          host: olirowan.xyz
        targets:
        - localhost
    target_config:
      sync_period: 10s
metrics:
  configs:
  - name: integrations
    remote_write:
    - basic_auth:
        password: <pass>
        username: <id>
      url: https://prometheus-prod-01-eu-west-0.grafana.net/api/prom/push
  global:
    scrape_interval: 60s
  wal_directory: /tmp/grafana-agent-wal
server:
  http_listen_port: 12345
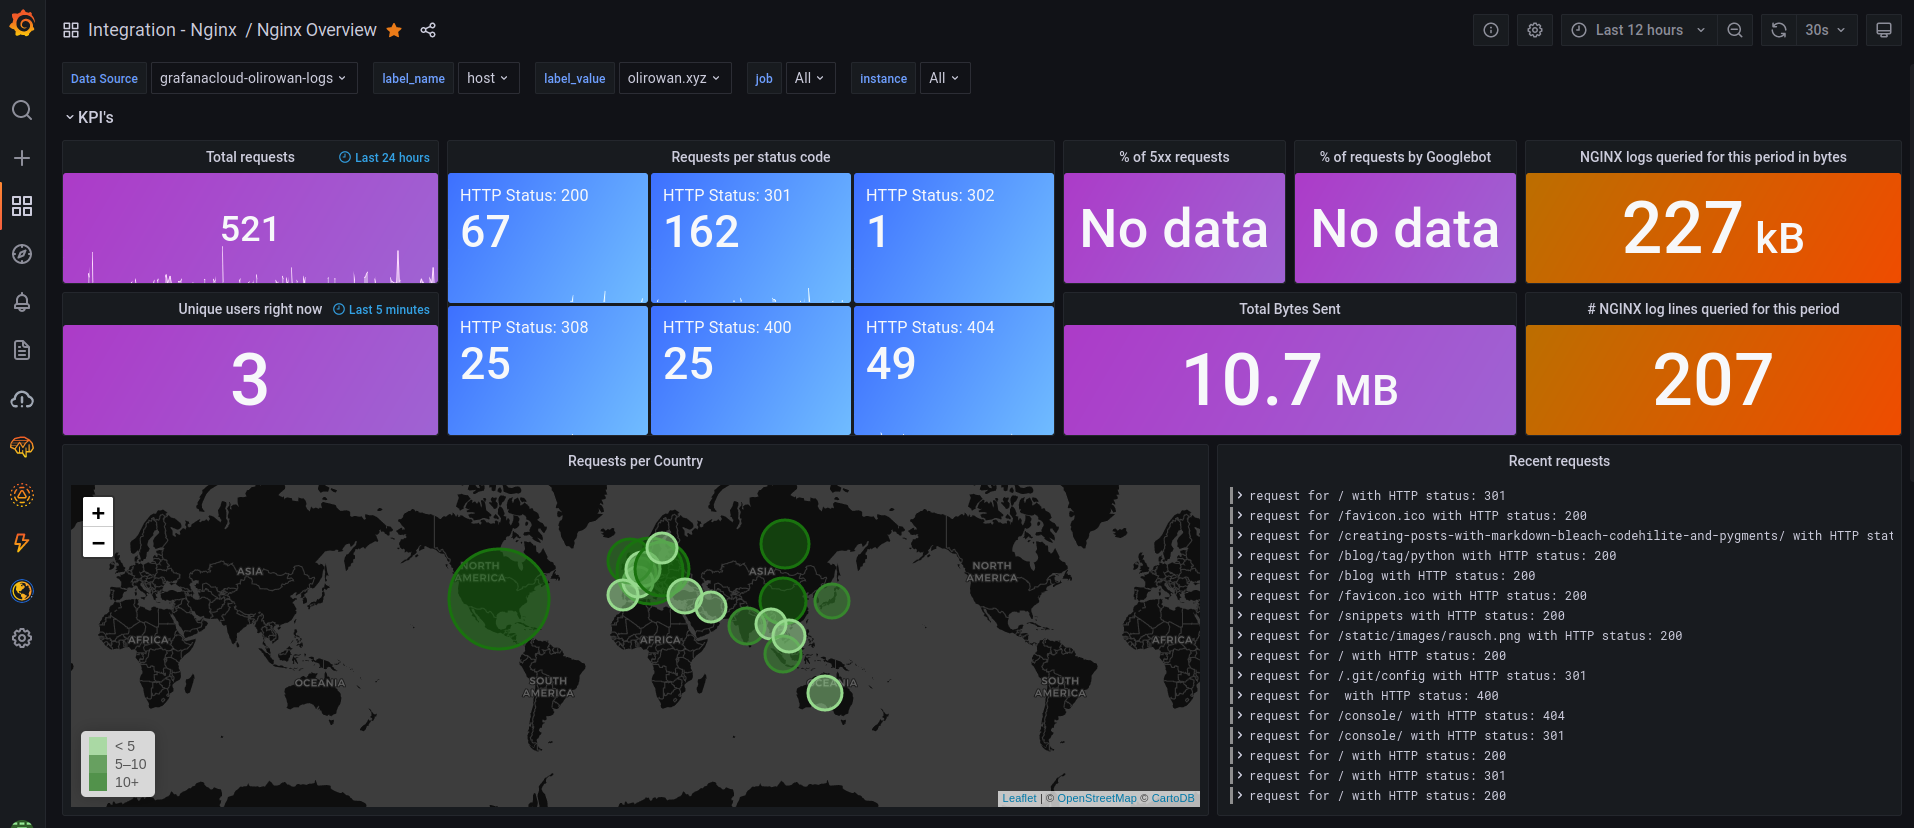
Once saved, restart the service then visit the already created dashboard for NGINX log visualisation.
sudo service grafana-agent restart